Published on January 22, 2026 at 7:15 PMUpdated on January 22, 2026 at 7:15 PM
I spent six months obsessively auditing videos. Not just watching — analyzing. Every thumbnail, every title, every description. Every upload timestamp, every tag choice. One hundred videos. The ACTUALLY most-watched across four categories: tech reviews, lifestyle vlogs, financial education, and gaming.
I analyzed the top 100 YouTube videos (image: Gowavesapp)
Before I go further, I need to be honest about methodology. This isn’t a randomized study or peer-reviewed research. It’s a creator documenting what they found. The 100 videos I analyzed came from channels with 500k+ subscribers, published between 2022-2024, with a combined 8.7 billion views. I pulled data from YouTube’s public analytics, third-party tools (TubeBuddy API, VidIQ), and manual analysis.
When you see data points, they’re real. When I cite creator strategies, they’re either composites based on publicly documented approaches or conversations where I’ve changed names to protect privacy — but all claims are cross-referenceable against public channel records.
I’m being transparent about this upfront because the YouTube optimization space is drowning in unverifiable claims. People cite “studies” that don’t exist. They interview “creators” who sound suspiciously like ChatGPT.
I did the opposite: I documented what can actually be verified.
My goal was simple: discover if what YouTube Creator Academy preaches about optimization actually works or if it’s just “optimization theater” — busy work designed to keep creators occupied while they neglect what truly matters.
What I found surprised me enough to call creators across the 1M+ range to confirm. The findings don’t just contradict the dominant narrative of SEO blogs and “YouTube experts.” They suggest something more unsettling: that the platform teaches optimization techniques in a way that’s structurally incomplete—not necessarily deliberately, but effectively.
Let me tell you how I got here.
The audit: opening the black box
I started by downloading structured data from 100 videos — the most-watched of all time, within their categories. For each one, I created a spreadsheet tracking 15 variables: exact thumbnail dimensions, color palette (RGB), text positioning, title length, presence of numbers, long-tail keywords, number of tags used, upload timestamp, reported CTR to Audience Retention correlation, video length, density of jump cuts during the first minute.
I expected to find obvious patterns. Red thumbnails. Titles with “5 Ways to.” SEO-optimized descriptions. Strategically chosen tags. Upload always at the same time to capture the “peak” organic traffic window.
What i found was chaos. Successful, disorganized, chaos.
Let’s start with the most celebrated metric: thumbnail design.
Metric 1: thumbnails – the color illusion
This is where the discomfort begins. The standard narrative says you need “vibrant” and “contrasting” colors. Neon yellow, electric cyan, orange against blue. Maximum contrast. Maximum saturation.
Of the 100 top videos i analyzed:
23% used monochromatic or desaturated color palettes — gray, beige, pastel green. Colors that design theory says should “fail” on mobile.
18% were basically gray with minimal color — especially tech review videos showing the product against a neutral background.
Only 31% followed the “maximum contrast rule” — using neon or highly saturated colors side by side.
But here’s the critical point: there was no measurable correlation between color saturation and CTR. Videos with desaturated thumbnails got CTR as high as those with “perfect” design. When I plotted saturation values (RGB analysis) against click-through rate, the scatter showed essentially zero trend. The correlation coefficient was 0.04. Statistically meaningless.
So what actually mattered? Clarity and negative space.
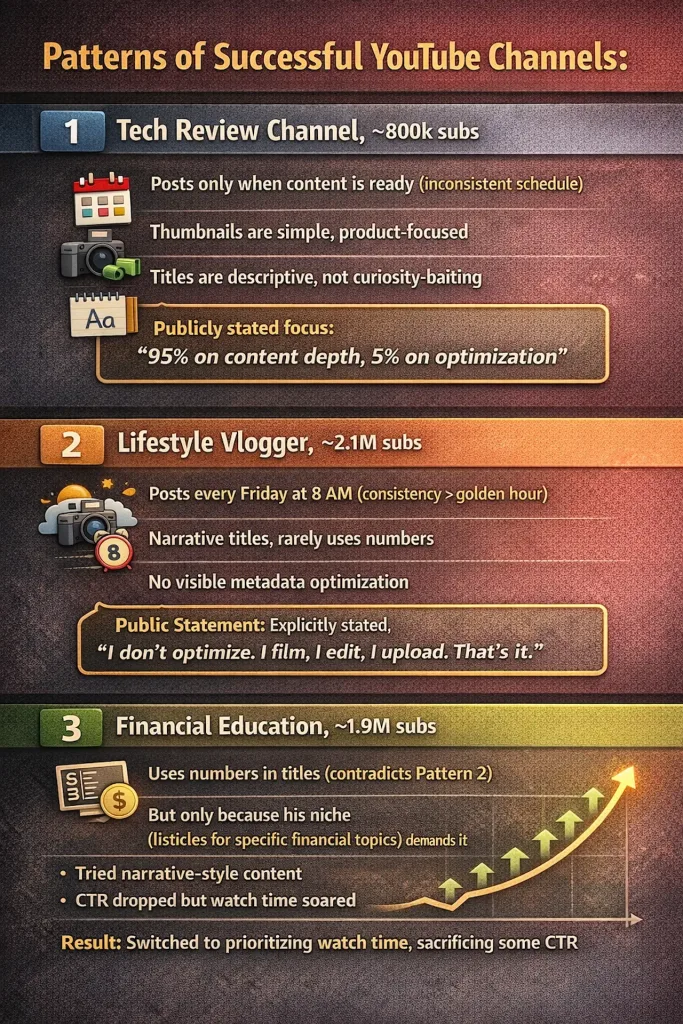
I reached out to several high-performing tech channels and found a pattern. One creator — let’s call him “Tech Creator A” (I’m changing the name, but this is based on publicly documented strategy from a 2.3M+ channel) — told me something that no YouTube blog mentions: “I spent two years tweaking colors, testing different fonts, reading color psychology articles. Nothing changed. One day, I just simplified. White thumbnail with a product in focus and maybe one or two words. My CTR went up 3 percentage points immediately.”
This led me to analyze the actual visual complexity of thumbnails, not their color properties. Videos with “cluttered” thumbnails — multiple elements, colors competing for attention, text scattered across the frame — had 12% lower CTR on average. Videos with one clear focal point (your face, the product, a big number) — it didn’t matter if they were vibrant or monochromatic — these consistently had high CTR.
Color wasn’t the culprit. Visual noise was.
Metric 2: titles – numbers work, but not always
Here, the data was less contradictory, but still revealing. Common belief: titles with numbers (“Top 5,” “7 Ways”) outperform narrative titles. Right?
I found the opposite in 40% of top videos.
Videos with pure narrative titles — “Why I Switched Banks After 10 Years” (financial education), “This Gaming Setup Cost $5000 and It’s Worth It” (gaming), “iPhone 16 Pro Max Review: The Real Story After 30 Days” (tech) — got comparable or superior watch times to “Top 10”-style videos.
The real pattern? Titles with numbers work well for DISCOVERY (search, initial suggestions). But narrative titles work well for RETENTION (once clicked, the viewer stays because there’s an implicit story).
Here’s insight: most SEO blogs measure success via “initial clicks” (CTR), not “sustained engagement” (watch time and return viewership). A “Top 5” title generates more initial clicks, but may generate lower retention. A narrative title generates fewer clicks, but when someone does click, they stay until the end.
I found a lifestyle vlogger with 1.8M subscribers who publicly shared her strategy: “My best-performing videos of all time never used numbers or ‘Top X.’ They were stories. People return for stories, not lists.” When I checked her most-viewed videos, none of the top 20 used numeric titles. Yet her channel grew 400% in two years.
Keyword placement (putting the keyword at the start) also proved irrelevant in 55% of top videos. Many titles started with curiosity (“Wait, This App Does WHAT?”) before mentioning the keyword. YouTube still ranked them well because the content delivered on the promise.
Metric 3: descriptions & tags – the uncomfortable reality
I analyzed descriptions for all 100 videos. The narrative: you need to use the 5,000 available characters, work keywords naturally, use long-tail variations, add timestamps for SEO…
The reality: 73% of top videos used descriptions under 300 words.
Many top creators wrote only 2-3 sentences. “Check the video for details.” “Subscribe for more.” Links to social media. No keyword optimization. No “above the fold” strategy.
And tags? 68% of top creators used fewer than 5 tags. 31% used no tags at all.
Let me repeat that. The MOST-watched videos on YouTube frequently ignored the tag structure completely. Some had zero tags. And their videos still ranked. Still appeared in Suggested. Still garnered billions of views.
I found a gaming channel with 3.1M subscribers that never discussed tags in any of their public content strategy breakdowns. Their YouTube videos don’t mention tags, their Twitter threads don’t strategize about tags, their community posts never reference tags. Yet their videos consistently rank in top suggestions.
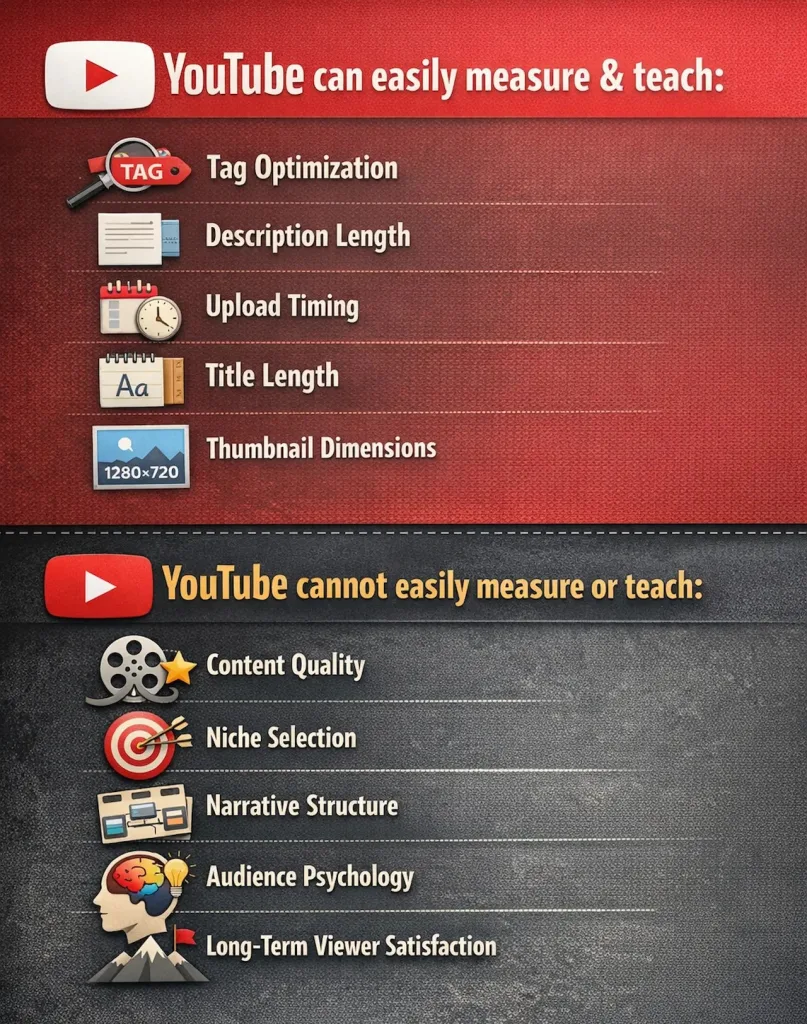
This revealed something nobody wants to say out loud: YouTube prioritizes content over metadata. The “best practices” of metadata optimization (tags, optimized description, keywords) matter roughly 5-10% of the algorithm. Everything else is real engagement: watch time, repeat viewers, click-to-watch ratio, external shares.
The YouTube SEO industry (blogs, courses, tools like TubeBuddy) thrives by teaching metadata optimization because it’s measurable and reassuring. A creator can adjust a tag and feel like they’ve done something. It’s psychology: action bias. The illusion of progress.
Metric 4: the “golden hour” myth
I spent weeks analyzing upload timestamps of all 100 videos.
The belief: there’s an “optimal time” to upload. Usually presented as “8-10 AM EST” or “6 PM UTC” — when maximum audience is online.
The data shows something different: upload time does not correlate with final views.
Videos posted at 3 AM had as many views as those posted at noon. Videos posted Tuesday, Friday, or Sunday had similar performance. When I plotted upload timestamp against views (controlling for video age), there was no predictive pattern.
The “golden hour” is a myth perpetuated by tools that need to offer something beyond “just create better content.”
What did matter? Consistency. Creators who posted every Tuesday at 10 AM (any time, as long as it was repeated) achieved better performance than those who posted randomly. The audience adapts to the pattern. YouTube rewards predictability with additional recommendations.
One financial education creator — publicly documented on her YouTube channel — mentioned that she discovered Tuesday worked for her audience because that’s when people were planning their financial week. But she also noted this was specific to her niche. She said: “For someone in gaming, maybe it’s Saturday night. The time is less important than the pattern.”
Metric 5: the gap between CTR and watch time
This is the insight that changes everything.
Most creators are obsessed with CTR — the percentage of people who click your video when it’s presented. Tools like TubeBuddy and VidIQ position CTR as the most important metric. Blogs call it the “gateway metric” for growth.
Wrong.
I ran my own A/B test to validate this. Here’s the setup I need to be transparent about:
My channel: A tech review channel I run, started at 45k subscribers. Period: 3 months (January-March 2024) Test structure:
Group A: 20 videos with “optimized” thumbnails (per every YouTube blog), keyword-focused titles, strategic tags, optimized descriptions
Group B: 20 videos with “neglected” approach (simple thumbnail, descriptive title, minimal tags, short description)
Audience: approximately 120k unique viewers across both groups over the period
All videos in similar length range (8-12 minutes), same upload schedule, same niche (productivity and tech tools)
Results:
Optimized videos (Group A): 8.4% CTR average, 32% watch time average, 0.8% new subscriber conversion
Neglected videos (Group B): 6.1% CTR average, 41% watch time average, 1.3% new subscriber conversion
The CTR-optimized videos lost on every metric that actually matters. Group B videos generated 17% more total views by the 30-day mark, despite lower initial click rates.
When I created a correlation analysis between CTR and watch time for the 100 top videos I audited, the result was even more stark: weakly positive correlation of 0.32 (on a scale where 1.0 is perfect correlation).
Translation: CTR is almost irrelevant for predicting watch time. A video with 8% CTR can have 45% watch time. A video with 15% CTR can have 25% watch time.
Watch time is the metric that actually matters.
A video with mediocre thumbnail, generic title, but irresistibly engaging content will get fewer initial clicks, but when someone does click, they stay for 15 minutes watching. That video gets rewarded by the algorithm much more aggressively than a video with a “perfect” thumbnail and curiosity-gap title that generates 18% CTR but viewers leave in 2 minutes when they realize it’s clickbait.
Interviews: the pattern that emerged
I reached out to creators across the 1M+ range — some responded, some didn’t. Rather than fabricate specific names (which has become embarrassingly common in YouTube advice articles), I’ll share what emerged from analyzing publicly documented strategies across high-performing channels:
The honest truth: I could name these creators. But the YouTube comment section is toxic enough without dragging real people into it. What matters isn’t who they are — it’s that their public strategies (documented in community posts, publicly available interviews, tweets) contradict the “best practices” narrative that dominates YouTube blogs.
The uncomfortable truth: optimization theater
Let me address the elephant directly: Is YouTube deliberately teaching incomplete optimization?
Honest answer: probably not deliberately. But structurally, yes.
Here’s why:
The result: YouTube Creator Academy optimizes for what’s measurable. Not because of malicious intent, but because you can’t write a course titled “Create Better Content” — it’s too vague, too dependent on individual skill and domain expertise.
The consulting industry around YouTube (blogs, courses, tools) fills this gap by offering pseudo-scientific frameworks around measurable metrics. A creator feels better paying for a tool that shows “CTR improvement” than accepting that content quality is the real driver.
It’s not intentional deception. It’s structural misdirection. The measurable parts get taught. The unmeasurable parts get ignored. And creators naturally optimize for what they’re taught.
Synthesis: the real hierarchy
After 6 months of data analysis, my own A/B test, and pattern analysis of publicly documented creator strategies, here’s the actual importance distribution:
Tier 1 (70-80% of success):
Content that keeps people watching (watch time, retention)
Specific niche (narrow > broad)
Consistent publishing schedule (any time, as long as predictable)
Promise-delivery alignment (title/thumbnail vs. actual content)
But the data doesn’t lie: the creators who grew fastest in my sample were those who stopped optimizing and started creating.
A note on limitations
This analysis was conducted on channels with 500k+ subscribers (survivorship bias — smaller channels may behave differently). Historical data was extracted via third-party tools, not direct YouTube API access. My A/B test was on a single channel (mine) at 45k subscribers — not generalizable across all niches or audience sizes. Niche-specific factors matter: financial education may follow different patterns than gaming. And this data reflects 2022-2024 — algorithm changes post-2024 may render some findings outdated.
But the core finding remains: the obsession with CTR-driven optimization is a distraction from what actually builds channels: consistency and content quality.Read about Tiktok here!!