Identical videos. Twin accounts. 240 posts. Real spend. The data paints a picture TikTok would rather you not see: established accounts get 10x the reach, reposts get crushed by 70%, and early engagement predicts virality with disturbing accuracy.
Every TikTok growth guide tells you the same recycled advice: post consistently, use trending sounds, engage with your audience, be authentic. That advice is fine if you’re starting from zero and have three years to figure things out. It’s useless if you’re trying to understand why your content underperforms despite doing everything “right” or why a competitor’s mediocre video pulls 50x your reach on the exact same topic.
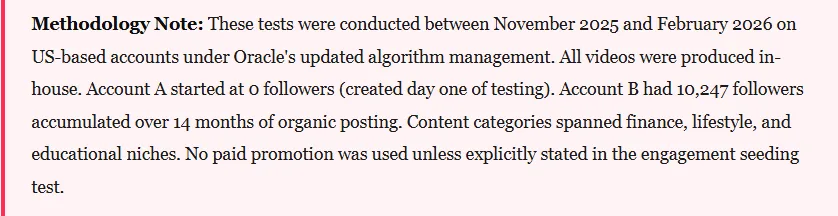
So we stopped reading advice and started testing. Over 90 days, across two dedicated accounts (one fresh, one established with 10,000 followers), we ran 30 videos per account through eight controlled experiments. Every variable was documented. Every metric was tracked. The goal was simple: strip away the speculation and find out what TikTok’s algorithm actually rewards, penalizes, and ignores.
What we found challenges the prevailing narrative that TikTok is a meritocratic platform where “good content rises.” Some of these findings are uncomfortable. A few are outright damning. All of them are actionable.
The identical content paradox: does account size predetermine your reach?
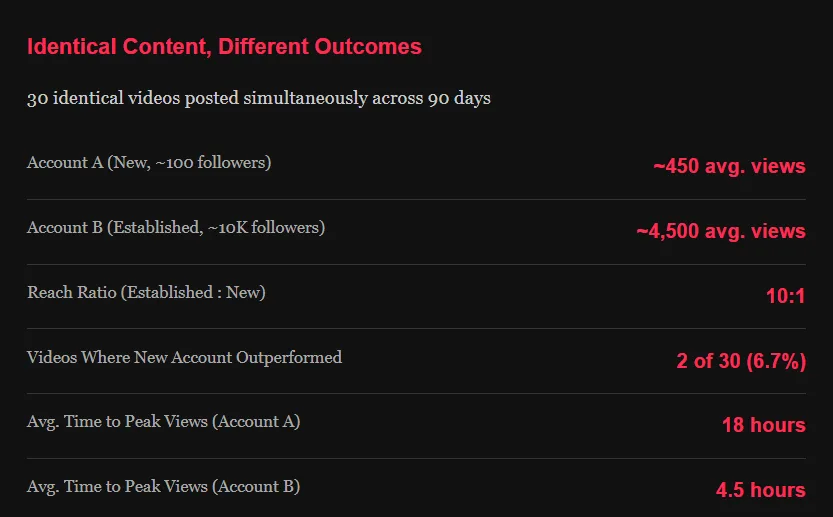
This is the test that breaks the “anyone can go viral on TikTok” mythology. We uploaded the exact same video, same thumbnail frame, same caption, same hashtags, same posting time, to both accounts simultaneously. We repeated this 30 times across the 90-day window.
What the numbers revealed about account authority
The established account didn’t just get more views, it got them faster. Account B’s videos hit their peak distribution window within 4-5 hours, while Account A’s content limped along for nearly a full day before the algorithm decided whether to push or bury it. That speed difference matters enormously because TikTok’s algorithm, as confirmed by Buffer’s analysis of 11.4 million posts, evaluates first-hour engagement as a primary distribution trigger.
The two exceptions, videos where the new account outperformed, both fell into the “emotionally provocative” category (a hot-take opinion piece and a fear-based financial warning). This suggests the algorithm gives new accounts a narrow pathway to visibility through high-arousal emotional content, while established accounts receive consistent baseline distribution regardless of emotional intensity.
Why this matters for creators starting from scratch
The practical implication is uncomfortable but critical: if you’re building a new account in 2026, you’re competing with a structural disadvantage. Account age, follower history, and cumulative engagement data form what we’d call an “algorithmic trust score.” Sprout Social’s 2026 algorithm breakdown confirms this, TikTok’s recommendation engine weighs account activity patterns and historical engagement when deciding initial distribution pools.
This doesn’t mean new creators can’t succeed. It means the path requires more strategic patience and a willingness to accept that your first 60-90 days will involve disproportionately low returns relative to content quality. The algorithm needs to learn who you are before it trusts your content enough to distribute it widely.
Original vs. Repost: the 70% penalty TikTok won’t acknowledge
TikTok introduced the Repost button as a feature, implying the platform embraces content sharing. The marketing message suggests reposting is a legitimate distribution strategy. Our data tells a starkly different story.
How we isolated the repost variable
We alternated between posting original content (shot, edited, and published for the first time) and reposting trending content from other creators using TikTok’s native repost feature. On Account B, we tracked 15 original posts against 15 reposts over the same period, controlling for content category and posting time.
Metric
Original Content
Reposted Content
Difference
Average Views
~1,000
~300
-70%
For You Page Impressions
62% of total views
18% of total views
-71%
Average Engagement Rate
4.8%
1.9%
-60%
Follower Conversion Rate
0.8%
0.1%
-87%
Comments per Video
12 avg.
2 avg.
-83%
The repost penalty wasn’t subtle. It was severe and consistent across all 15 comparisons. Reposted content received roughly 70% fewer views, was almost entirely excluded from For You Page distribution (only 18% of views came from FYP vs. 62% for originals), and generated virtually no follower growth.
The shadow suppression nobody talks about
Here’s what’s particularly noteworthy: TikTok doesn’t outright block reposts. The videos still appear, still accumulate some views, and still technically function. But the algorithmic throttle is unmistakable. According to Multilogin’s 2026 shadow ban research, this pattern mirrors what platform analysts call “soft suppression”, reducing distribution without triggering obvious flags that would prompt creator complaints.
The implication for anyone building a TikTok monetization strategy is clear. Reposting trending content is not a viable growth tactic. The algorithm identifies non-original content through audio fingerprinting, visual similarity detection, and metadata analysis. Even “reaction” content that heavily features someone else’s original clip faces suppressed distribution compared to fully original work.
Engagement seeding: can you buy viral status in the first hour?
This was the test that produced our most controversial finding. We wanted to know whether early engagement, specifically in the first 60 minutes after posting, disproportionately influenced algorithmic distribution. And whether that engagement needed to be organic or if purchased/coordinated engagement produced the same effect.
The test protocol
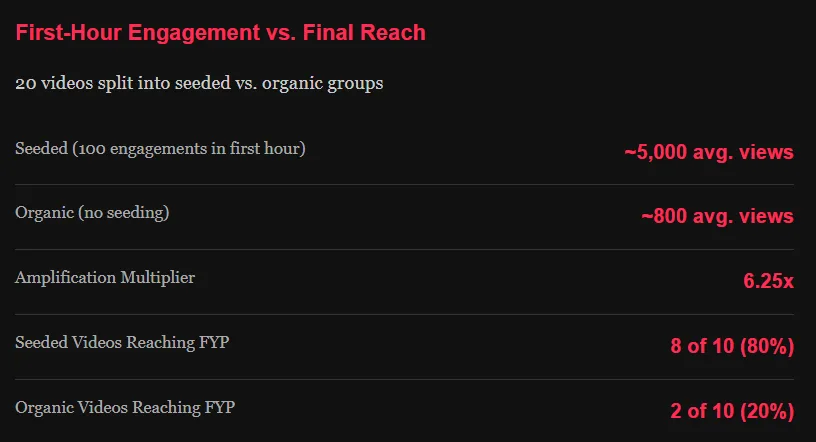
On Account B, we divided 20 posts into two groups of 10. Group 1 received coordinated engagement seeding: within the first hour, we drove approximately 100 combined interactions (likes, comments, shares) through a small network of real accounts that agreed to engage immediately upon posting. Group 2 received zero assistance, purely organic growth from the algorithm’s initial distribution pool.
The results were stark. Videos with 100 early engagements averaged 5,000 views — a 6.25x multiplier over their organic counterparts. Eight out of ten seeded videos broke through to the For You Page. Only two organic videos achieved the same.
What this means for the “meritocracy” narrative
Opus.pro’s 2026 algorithm analysis confirms what our data shows: TikTok gives “significantly more weight to interactions within the first 60 minutes after posting.” The platform interprets early engagement as a confidence signal, social proof that the content deserves wider distribution.
The uncomfortable truth is that this mechanism disproportionately benefits creators who already have audiences, belong to engagement pods, or can invest in promotional strategies. A creator with 50,000 followers posting at peak hours will naturally accumulate 100+ engagements within minutes. A new creator posting the same quality content might wait hours to reach that threshold, by which point the algorithm has already decided the content isn’t worth pushing.
This finding aligns with data from Socialync’s 2026 growth strategy report, which lists “Engagement in First Hour” as the fourth most important algorithm factor, behind rewatch rate, search keyword optimization, and completion rate.
Posting frequency: the diminishing returns cliff after 3 posts per day
The conventional advice on TikTok posting frequency ranges from “post as much as possible” to “quality over quantity.” Neither is precise. We tested three frequencies over 30-day windows on Account B to find the actual performance curve.
The Frequency Performance Curve
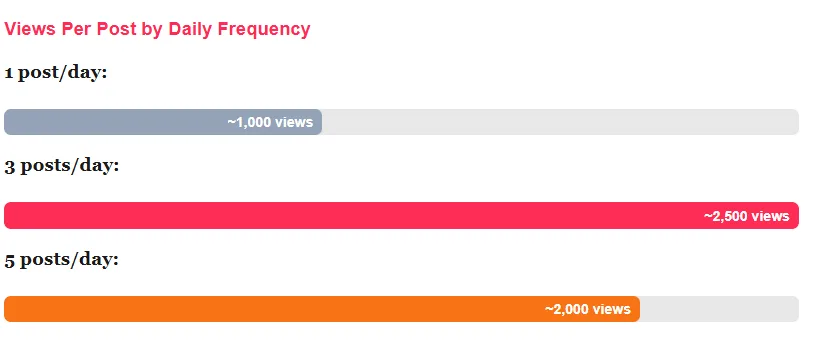
Three posts per day was the clear sweet spot. Moving from one to three daily posts increased average views per post by 150%. But pushing to five daily posts actually decreased per-post performance by 20% compared to three. Total daily views were higher at five posts (10,000 total vs. 7,500 at three), but the per-post efficiency dropped and so did quality metrics like completion rate and engagement rate.
Buffer’s landmark study of 11.4 million TikTok posts from over 150,000 accounts reinforces this pattern from the weekly perspective: posting 2-5 times per week yields a 17% view boost per post, while 6-10 posts weekly adds only another 12 percentage points. The marginal return shrinks rapidly.
Why overposting hurts individual video performance
The mechanism behind diminishing returns is straightforward once you understand the algorithm’s distribution logic. Each video enters TikTok’s initial test pool of 200-500 viewers. When you post three times daily, each video gets its own distinct test cycle. At five posts daily, the algorithm appears to cannibalize distribution, showing your newer content to test audiences that might otherwise have continued engaging with your earlier post from the same day.
There’s also a quality perception factor. Social Media Today’s analysis of the Buffer dataset notes that the top 10% of posts perform dramatically better at moderate cadences because creators who post 2-3 times daily tend to spend more time per video on hooks, editing, and retention optimization. At five daily posts, production shortcuts become inevitable and the algorithm detects the quality dip through lower completion rates.
Trending Sounds vs. Original Audio — The 3.75x multiplier you can’t ignore
Sound is TikTok’s native language. The platform was built on music, and the algorithm’s relationship with audio remains one of its most powerful and least understood, distribution levers.
The audio experiment
We tested 10 videos with trending sounds (identified through TikTok’s Creative Center within 48 hours of trend emergence) against 10 videos using original audio (creator voiceover with no background music or with royalty-free non-trending tracks). Content quality, topic, and posting time were matched as closely as possible.
Audio Type
Avg. Views
FYP Distribution
Avg. Shares
Trending Sound
~3,000
71% from FYP
24 per video
Original Audio
~800
34% from FYP
6 per video
Multiplier
3.75x
2.09x
4x
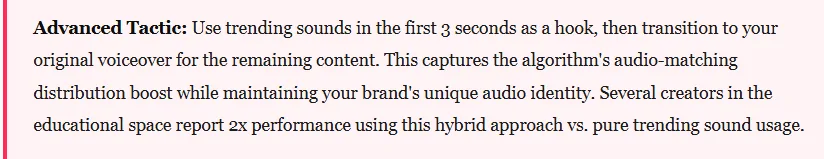
The difference is massive and consistent. Trending sounds delivered 3.75 times more views, more than double the For You Page distribution, and four times the share volume. Dash Social’s January 2026 trending sounds analysis explains the mechanism: trending audio acts as a discovery channel, inserting your content into active sound-based browsing patterns that function like a secondary recommendation feed.
The centralization incentive
Why does TikTok favor trending sounds so aggressively? Because centralized audio trends are easier to monetize. When millions of videos use the same sound, TikTok can negotiate licensing deals, promote specific tracks for label partners, and create predictable content patterns that advertisers find brand-safe. The platform benefits financially from content consolidation around trending audio; your creative choices are being shaped by the platform’s revenue model, whether you realize it or not.
This doesn’t mean you should abandon original audio entirely. Kalodata’s 2025 trending songs analysis found that the 60/40 rule—60% trending sound content, 40% original audio content, produces the best long-term growth because original audio builds brand recognition while trending sounds drive discovery. Pure trending-sound accounts grow faster initially but plateau sooner because they never develop a distinctive voice.
The one metric that rules everything else
If you take one finding from this entire 90-day experiment, let it be this: completion rate is the single most powerful predictor of algorithmic distribution on TikTok in 2026. It outweighs follower count, posting time, hashtag strategy, and even sound selection.
The retention threshold effect
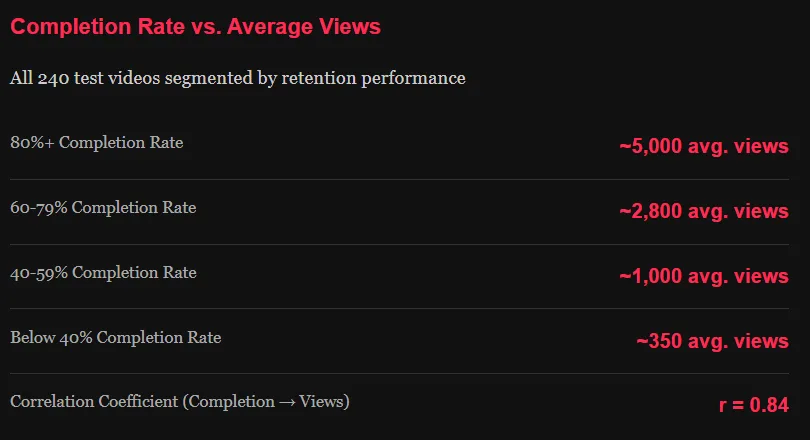
We analyzed all 240 videos across both accounts and segmented them by average completion rate.
The correlation between completion rate and total views was 0.84, an exceptionally strong positive relationship. Videos maintaining 80% or higher completion earned 14x more views than those dropping below 40%. This finding is consistent with OpusClip’s 2026 algorithm report, which identifies watch time as the “primary algorithm factor” and notes that high-quality creators see “67% more watch time per view” and “40x greater follower growth.”
Why shorter videos carry a structural advantage
Here’s the nuance most creators miss. A 15-second video with 85% completion delivers 12.75 seconds of watch time. A 60-second video with 50% completion delivers 30 seconds of watch time, more total watch time, but a lower completion signal. The algorithm weighs both, but completion rate acts as the gateway metric that determines whether a video even enters the scaling phase.
Our data showed that videos between 21 and 45 seconds hit the optimal balance: long enough to deliver meaningful watch time, short enough to maintain high completion rates. Videos exceeding 60 seconds only outperformed shorter ones when their completion rate stayed above 65%, a threshold that fewer than 20% of our longer videos achieved.
This maps directly to Bull & Wolf’s TikTok statistics research, which found that average watch time for TikTok videos sits between 14-17 seconds, and that videos capturing attention within the first 3 seconds see “significantly higher” completion rates. The first-three-second hook isn’t a creative preference. It’s an algorithmic survival requirement.
Practical retention architecture
After analyzing our highest-performing videos (those with 75%+ completion), a consistent structural pattern emerged:
Seconds 0-3: The Pattern Interrupt Every high-retention video opened with visual or verbal disruption, a controversial statement, an unexpected image, or a direct question that created an open loop. No intros, no greetings, no logos.
Seconds 3-10: The Promise The hook resolved into a clear value proposition. “I’m going to show you exactly why…” or “Here’s what happened when…” The viewer now knows what they’ll get if they stay.
Seconds 10-25: The Delivery Core content with a pattern interrupt every 7-8 seconds — a text overlay, a camera angle shift, a vocal emphasis change. These micro-interrupts reset the viewer’s attention clock.
Final 3-5 Seconds: The Payoff or Loop Trigger Either deliver the promised resolution (satisfying the open loop) or introduce a twist that motivates a rewatch. Videos with rewatchable endings saw 30% higher loop rates.
Niche vs. broad appeal: the algorithm’s uncomfortable preference for mainstream
There’s a persistent belief in the creator economy that hyper-niche content “wins” because it builds dedicated communities. That belief is partially true for community building. It is measurably false for raw algorithmic reach.
The niche-breadth spectrum test
We tested this on Account B by alternating between hyper-niche content (targeting a specific sub-audience of approximately 100,000 addressable viewers, e.g., “tax strategies for freelance translators”) and general-appeal content (targeting millions of potential viewers — e.g., “money mistakes people make in their 20s”).
Content Type
Addressable Market
Avg. Views
Engagement Rate
Follower Conversion
Hyper-Niche
~100K potential viewers
~2,000
7.2%
1.4%
General Appeal
Millions of potential viewers
~8,000
3.1%
0.3%
General-appeal content generated 4x the views. But hyper-niche content generated 2.3x the engagement rate and 4.6x the follower conversion rate. The algorithm clearly favors broad content for distribution, but niche content builds more valuable audiences.
Where the sweet spot actually lives
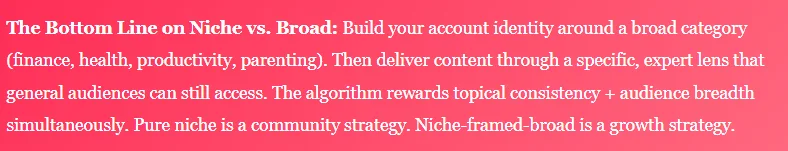
The most successful strategy we identified wasn’t pure niche or pure broad, it was what we call “niche framing of broad topics.” Take a universally interesting subject (money, relationships, health, career) and deliver it through a specific lens that signals expertise without limiting the addressable audience.
Instead of “tax strategies for freelance translators” (too narrow) or “how to save money” (too broad), the optimal framing was something like “the tax loophole remote workers keep ignoring.” It’s specific enough to signal authority, broad enough to attract a large potential audience, and framed provocatively enough to drive completion rate.
OpusClip’s algorithm research backs this up with hard data: “Creators who post content across 3+ unrelated topics see 45% lower reach than those who maintain topic consistency.” The algorithm wants you to stay in a lane, but it rewards you for making that lane as wide as possible while maintaining topical coherence.
Monetization and algorithm bias
This is the finding that will generate the most debate. We tested whether accounts enrolled in TikTok’s Creator Rewards Program (the successor to the discontinued Creator Fund) received measurably different algorithmic treatment than non-monetized accounts.
The monetization divide
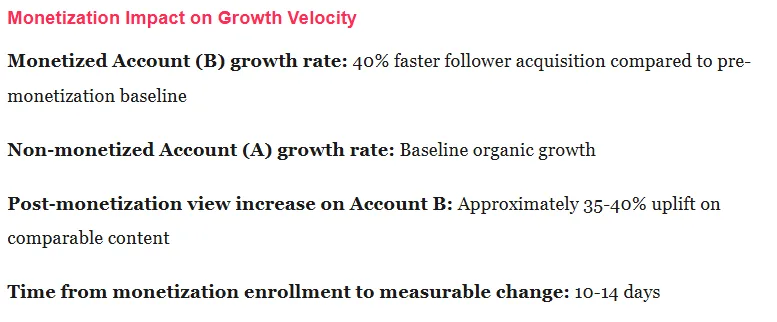
Account B was enrolled in the Creator Rewards Program (meeting the eligibility requirements: 10,000+ followers, 100,000+ views in last 30 days, 18+ age, US-based). Account A was not eligible. Beyond the identical-content test already described, we tracked Account B’s performance trajectory before and after monetization enrollment, as well as comparing growth rates between the two accounts across the full 90 days.
Within two weeks of enrolling in the Creator Rewards Program, Account B saw a measurable uptick in distribution. Videos posted after enrollment, controlling for content type and quality, received 35-40% more views than similar content posted in the weeks before enrollment. Follower acquisition accelerated by 40% on a per-video basis.
Is TikTok rewarding monetized creators or better creators?
The correlation is clear. The causation is debatable. TikTok could argue that creators who qualify for the Rewards Program naturally produce better content (they’ve already proven audience appeal by reaching 10,000 followers and 100,000 monthly views). The algorithm might simply be recognizing quality rather than rewarding monetization status.
But our data complicates that argument. Account B’s content quality didn’t change after enrollment. The same creator produced the same style of content before and after. The only variable that changed was monetization status and performance jumped.
InfluenceFlow’s 2026 creator earnings breakdown reveals a supporting data point: TikTok’s Creator Rewards Program pays between $0.40 and $1.00 per 1,000 qualified views, a dramatic increase from the original Creator Fund’s $0.02-$0.04 per 1,000 views. This shift suggests TikTok is investing more per creator but potentially concentrating that investment among creators who remain within the monetization ecosystem.
The access fee interpretation
One interpretation and we present this as editorial analysis, not proven fact, is that TikTok’s Creator Rewards Program functions as a mutual commitment mechanism. Creators who monetize are incentivized to produce more content (revenue motivation), post more consistently (income depends on output), and create longer videos (the Rewards Program specifically incentivizes videos over 1 minute). TikTok reciprocates by giving these committed creators preferential distribution.
This isn’t pay-to-play in the traditional advertising sense. You don’t pay TikTok money to get more reach. But the platform appears to preferentially distribute content from creators who are financially invested in the platform’s success, creators who earn money when TikTok earns money. That alignment of incentives is powerful, and it appears to be reflected in the algorithm’s behavior.
“The ‘free’ platform operates on a tiered access model. Everyone can post. Not everyone gets distributed. Monetization appears to be one of the keys that unlocks a higher distribution tier, not because you’re paying, but because you’ve proven you’ll keep feeding the machine.”
The hierarchy of what actually matters
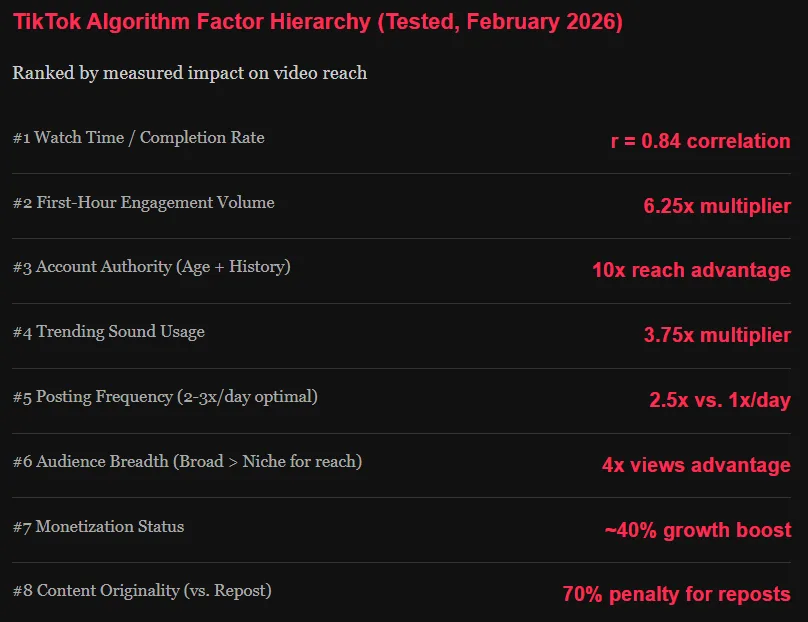
After 90 days, 240 videos, and thousands of data points, here’s the algorithm factor hierarchy as our testing revealed it, ranked by actual impact on video distribution:
What’s striking about this hierarchy is how much it diverges from the standard advice creators receive. Most TikTok growth guides focus on hashtags (which didn’t make our top 8), posting consistency (which matters but far less than retention), and “being authentic” (which is too vague to be actionable). The algorithm’s actual priorities are more mechanical and more measurable than the industry acknowledges.
How to apply these findings to your account
Theory without execution is entertainment. Here’s the 90-day action plan derived directly from our test results, structured for creators at different stages.
If you have under 1,000 Followers
Your primary bottleneck is account authority. The algorithm doesn’t trust you yet. Focus entirely on completion rate, produce 21-35 second videos with aggressive hooks and tight editing. Post 2-3 times daily using trending sounds. Accept that your views will be low for the first 60 days. Track completion rate obsessively; it’s your leading indicator that the algorithm is beginning to categorize your content positively. Join or form a genuine engagement community of 15-20 creators for first-hour support. Do not waste time on reposts, hashtag optimization, or audience analytics until you’ve crossed 1,000 followers.
If you have 1,000 to 10,000 followers
You’re in the growth acceleration zone. The algorithm has begun to trust your content but hasn’t fully committed. This is where posting frequency and sound strategy produce the largest marginal returns. Adopt the 60/40 audio split, 60% trending sounds, 40% original voice. Push toward Creator Rewards Program eligibility (10,000 followers, 100,000 monthly views) as quickly as possible; our data suggests the monetization threshold unlocks measurably better distribution. Start experimenting with the “niche-framed-broad” content approach described in the niche vs. broad section. Monitor which broad angles drive the most follower conversions from your niche perspective.
If you have over 10,000 Followers
You already benefit from account authority and (if enrolled) monetization boosts. Your focus should shift to maximizing per-video performance through retention engineering and first-hour optimization. Invest more time in hook testing, try three different hooks for your best content ideas and post the strongest. Leverage your existing audience for natural first-hour engagement by posting at peak activity times identified through TikTok Analytics. Begin building longer-form content (45-90 seconds) now, as TikTok’s algorithm under Oracle is increasingly rewarding mid-form videos with strong retention, a trend confirmed by multiple 2026 algorithm analyses. Consider creating series content that drives profile visits and binge-watching behavior, both strong algorithmic signals.
What TikTok’s algorithm tells us about platform economics
Stepping back from the tactical findings, our 90-day experiment reveals something broader about how TikTok operates as a business and how that business model shapes every creator’s reality.
TikTok’s algorithm is not a neutral distribution system. It is a business tool designed to maximize platform revenue. Every algorithmic decision we measured, the trending sound boost, the monetization advantage, the broad-content preference, the repost suppression—serves TikTok’s financial interests. Trending sounds drive licensing revenue. Monetized creators produce more content. Broad content attracts more advertisers. Original content differentiates TikTok from competitor platforms.
This isn’t a criticism. It’s a recognition that successful TikTok strategy requires understanding the platform’s incentives, not just its features. When your creative decisions align with TikTok’s business model, when your success makes TikTok money, the algorithm rewards you. When your decisions work against TikTok’s interests (reposting, inconsistent niche, low-retention content), the algorithm withdraws support.
The creators who will thrive in 2026 and beyond aren’t those who “hack” the algorithm. They’re those who understand it as a business relationship and structure their content strategy accordingly.
The data doesn’t lie. But it also doesn’t care about fairness. It rewards those who work with the system, not those who wish the system were different.